Community-Level
Property Risk Analysis
September 23, 2025
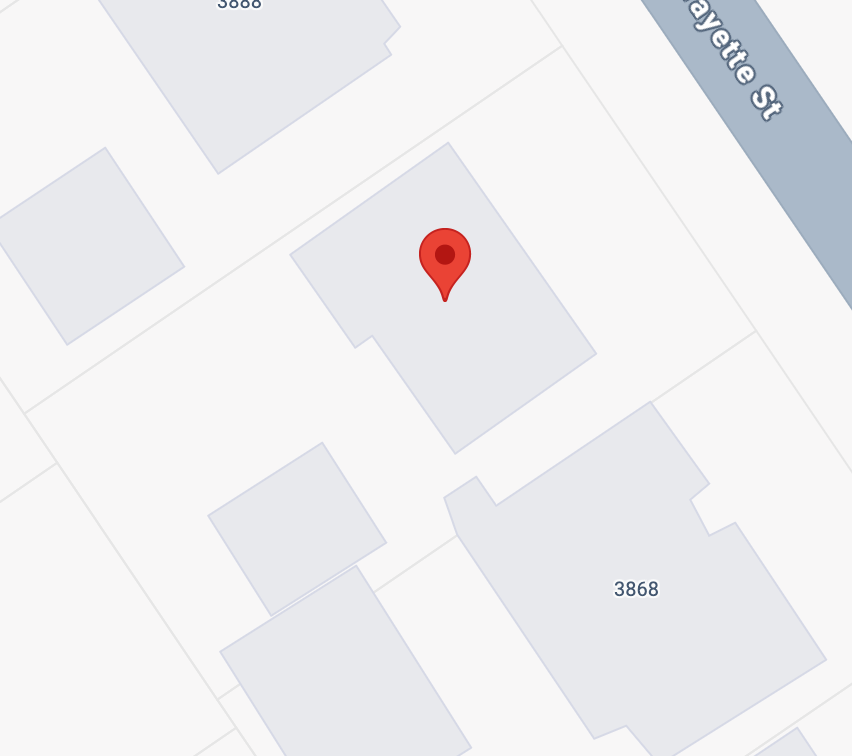
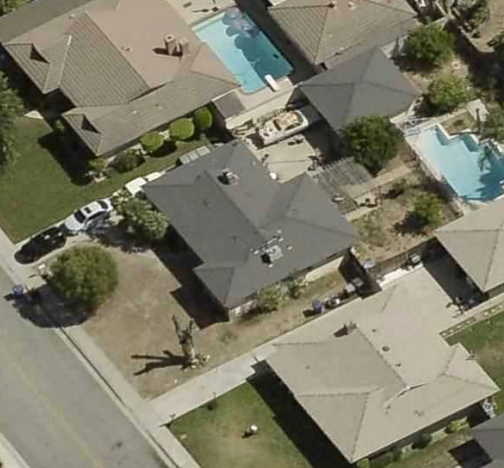
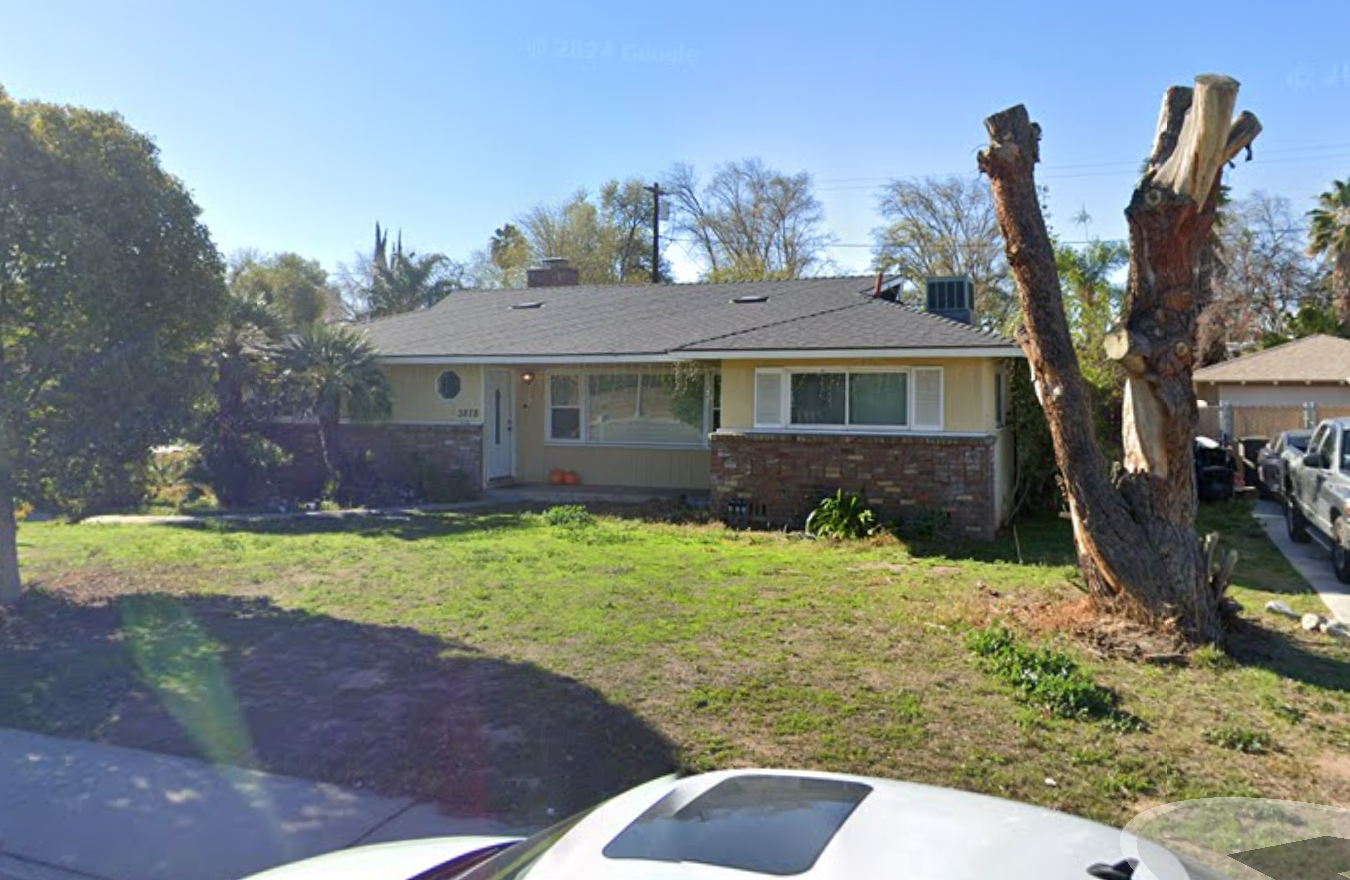
3878 Lafayette Street, Riverside, CA 92503
County: Riverside, CA, USA
GPS Location: 33°56'45.39" N, 117°24'36.88" W
|
|
|
Future Proof Community-Level Reports are a comprehensive ranking of current and future extreme weather risks to consider in your area. This information will empower you with a set recommendations to protect yourself, loved ones, and your property [investment].
Based on your property’s postal code risk calculations which incorporate local disaster factors along with surrounding conditions such as neighboring properties, daily climate (humidity, wind, proximity to water), fire protection, and community support services that influence survivability during extreme weather.
Remediation suggestions from Magic Window® address community-level risk reduction. For property-specific construction plans, budgets, and specifications, subscribers can use the upcoming Future Proof – XHome Survey™ application for tailored remodeling recommendations, including the materials and construction methods required for your unique property.
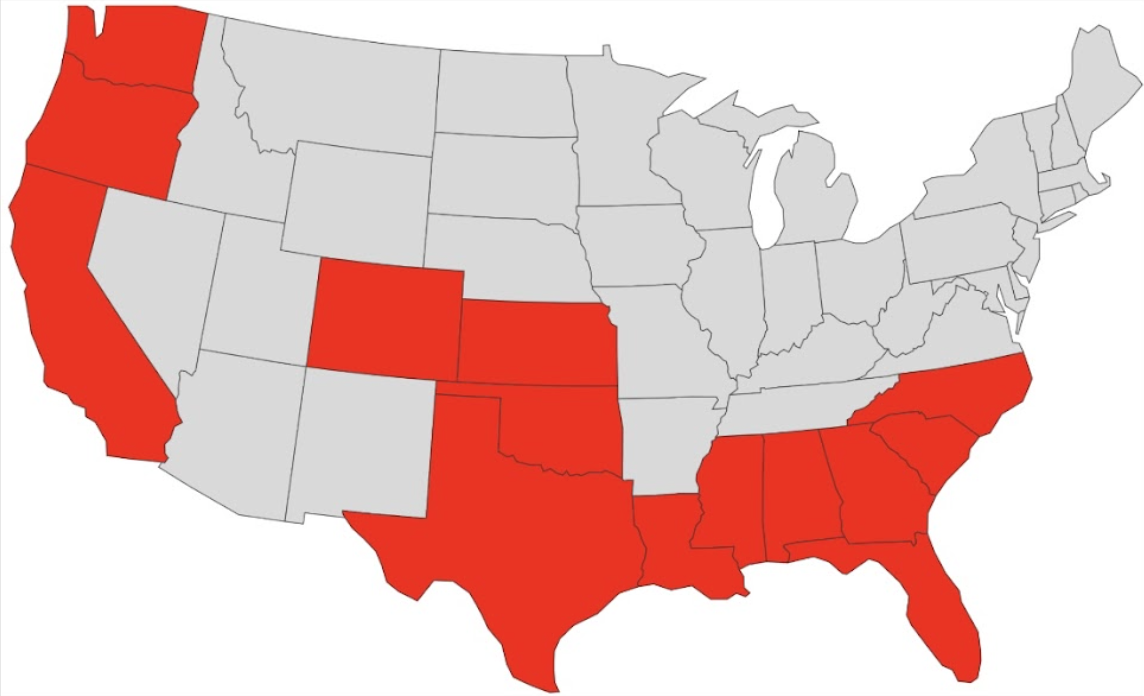
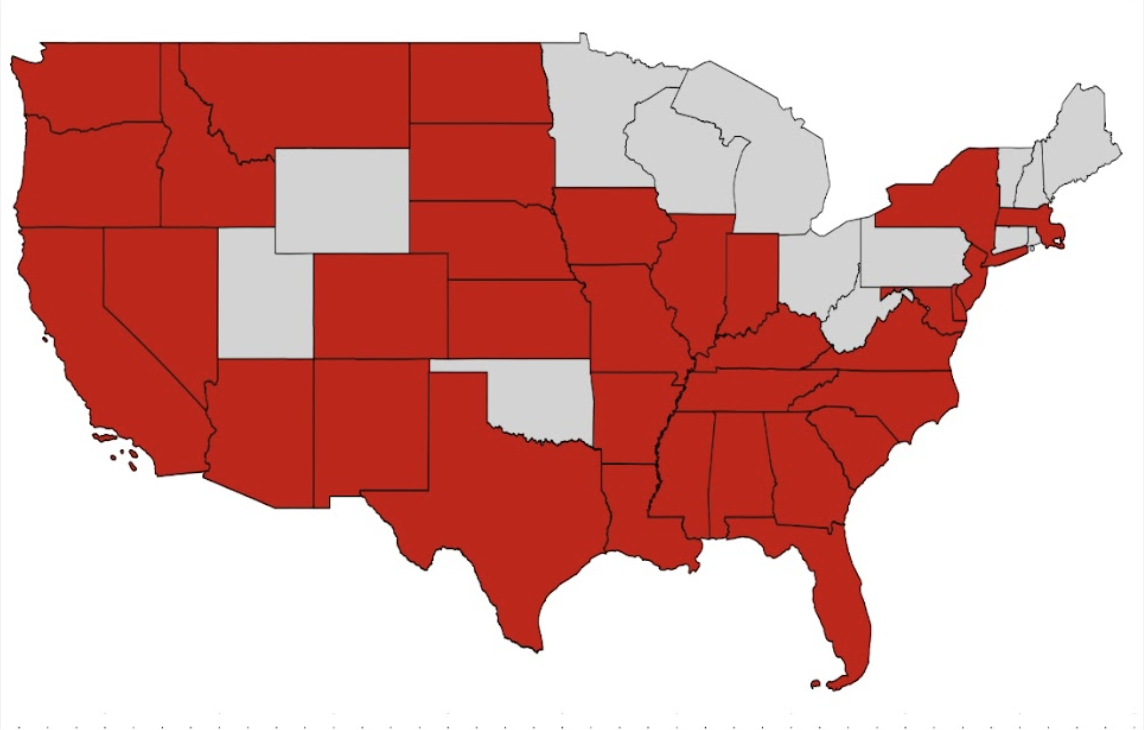
In the next decade, $1.47 trillion of home value in the United States could vanish as expanding extreme weather dangers are predicted to impact as many as 48 million properties (43.7 % of homes) and 120 million people (35.2% of the population). With insurance safety nets failing and government programs withdrawn, communities are left unprotected.
|
2025 |
|
2045 |
With an accelerating rate of extreme weather disasters, this report gives you recommendations to be better prepared:
|
|
Wildfire—fire-resistant materials, defensible space. |
|
|
Flood—elevation, home barriers, drainage. |
|
|
Tornado—reinforced safe rooms, wind-rated construction and modifications. |
|
|
Hurricane—impact-resistant windows, roof tie-downs. |
|
|
Drought—water generation, storage, xeriscaping. |
|
|
Heat—reflective roofing, ventilation upgrades. |
|
|
Seismic—structural bracing, foundation reinforcement. |
|
|
Precipitation—enhanced roofing, sealing, runoff control. |
Environmental hazards in your region are evolving with impacts that require both immediate attention and long-term planning. Homeowners, planners, and investors should consider this perspective when setting your priorities today and preparing for future adaptation. In the chart below, view trends in your area of extreme weather risk changes for specific hazards today, in three years and in 25 years.
|
Hazard |
Today |
In 3 Years |
In 25 Years |
Projected Trend |
|
Wildfire |
High |
High–Very High |
Very High |
⬆ Risk |
|
Heat |
High |
High–Very High |
Very High |
⬆ Risk |
|
Drought |
High |
High–Very High |
Very High |
⬆ Risk |
|
Precipitation |
Moderate–High |
High |
High |
⬆ Risk |
|
Flood |
Moderate |
Moderate–High |
High |
⬆ Risk |
|
Seismic |
Moderate |
Moderate |
Moderate |
↔ Persistent |
Note: Data sources include local and regional climate models, NOAA, FEMA, and IPCC projections
|
Hazard |
Risk Level (Today) |
Risk Level (Next 36 Months) |
3-Year Change |
Potential Consequences |
Potential Avoided Loss |
|
Wildfire |
High |
High–Very High |
⬆ Risk |
Ember ignition, smoke, evacuation |
$25,000–$90,000 |
|
Heat |
High |
High–Very High |
⬆ Risk |
Water intrusion, erosion |
$8,000–$25,000 |
|
Drought |
High |
High–Very High |
⬆ Risk |
Roof wear, HVAC load, health risks |
$500–$3,000 |
|
Flood |
Moderate |
Moderate–High |
⬆ Risk |
Landscape/tree loss, higher fire intensity |
$2,000–$10,000 |
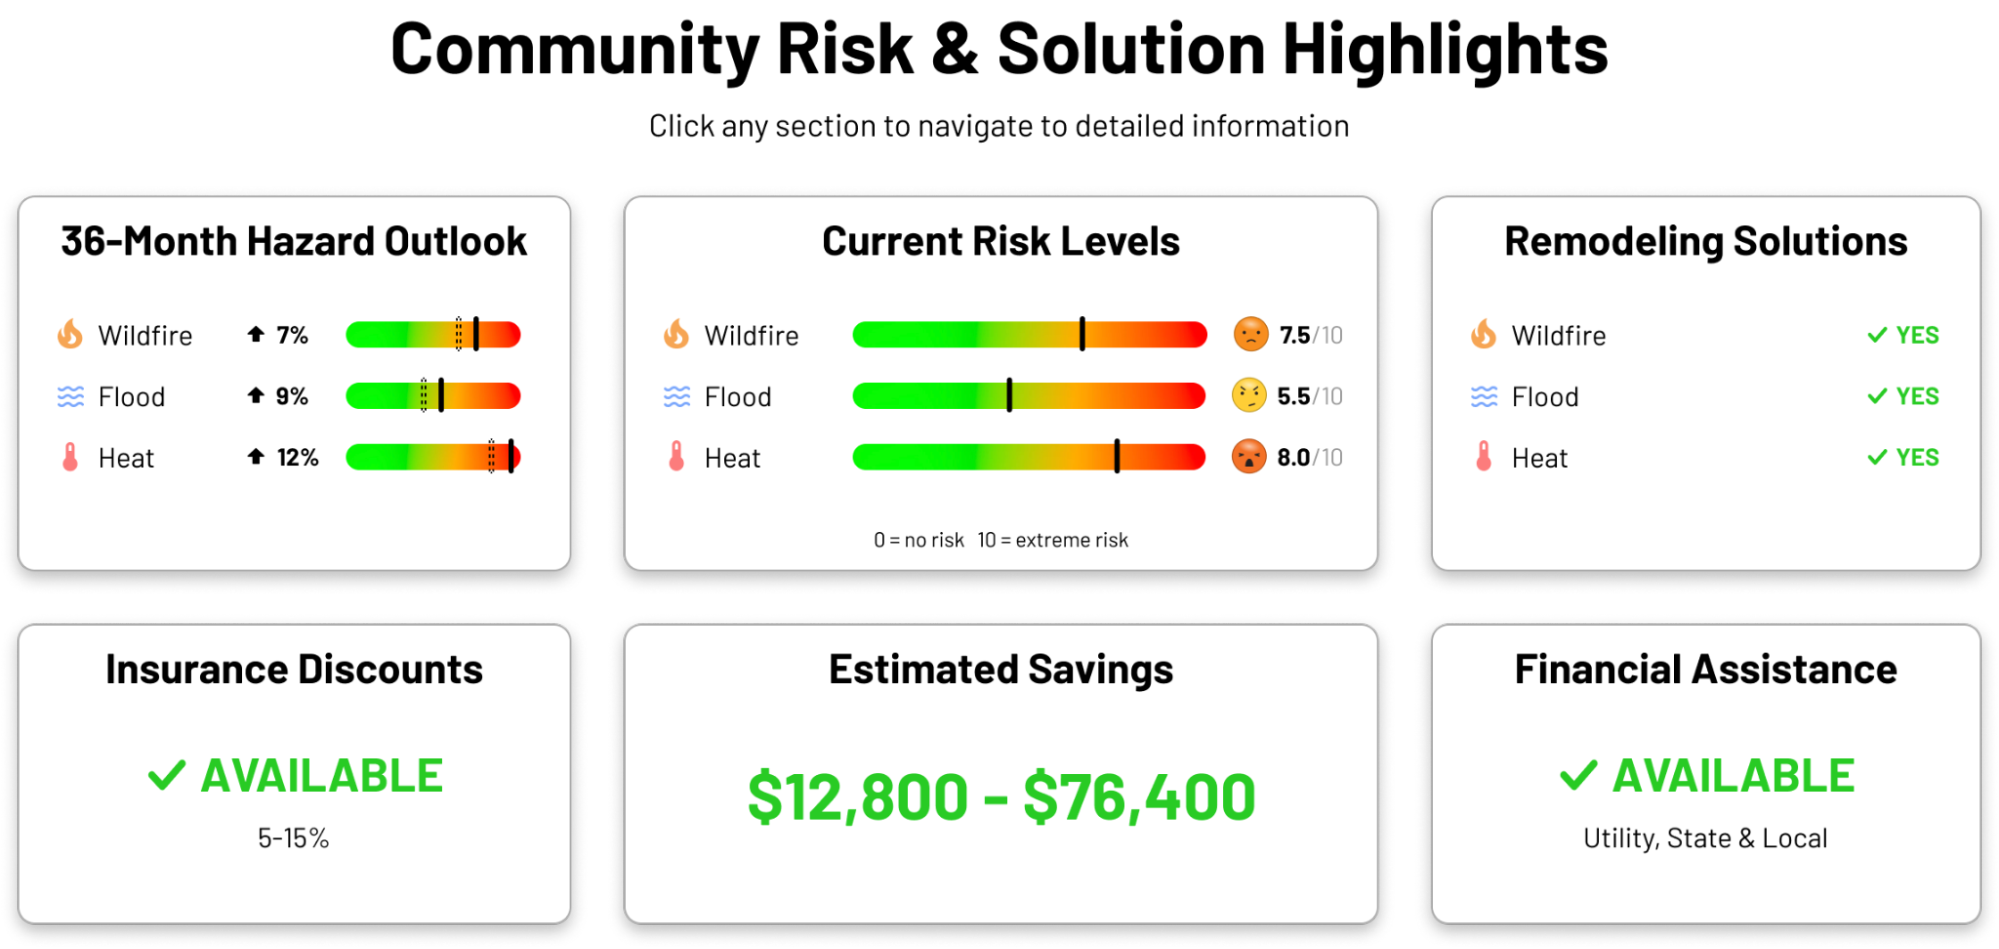
Over the next three years, Riverside is projected to experience higher wildfire danger due to drier vegetation, more intense winter storms leading to localized flooding, and a sharp increase in extreme heat days, with drought continuing to stress water supplies and landscaping. Taking action now through wildfire hardening, drainage improvements, and heat- and drought-resilient upgrades can reduce losses, lower costs, and improve safety.
The area experiences recurring heat, wildfire, drought, seismic shaking, and storm flooding, confirming the need for proactive mitigation.
This home faces a combination of fire, water, heat, and seismic stresses that require a layered approach to resilience. Wildfire remains the top near-term hazard, making defensible space, ember-resistant vents, and a Class-A roof the highest priority. Flood and stormwater risks can be managed through grading, drainage, and deployable barriers, while extreme heat calls for roof coatings, shade trees, and efficient HVAC upgrades. Persistent drought highlights the importance of xeriscaping, smart irrigation, and rainwater capture. Although seismic risk does not follow a seasonal pattern, the potential impact is severe; retrofitting foundations and securing heavy utilities remain critical long-term protections. By addressing these vulnerabilities in order of probability and cost-effectiveness, homeowners can reduce direct losses, improve comfort and livability, and qualify for insurance discounts and rebates that offset upfront costs.
Riverside regularly experiences triple-digit heat. Rising hot days stress roofs, HVAC systems, and increase electricity costs.
|
Risk Level |
Recommended Upgrade |
Why It Helps |
Est. Cost (Project) |
Est. Cost per Unit |
Product Link |
|
9/10 |
Cool roof coating or reflective shingles |
Reduces heat load on structure |
$3,000–$7,000 |
$2–$5/sq ft |
|
|
8/10 |
Radiant barrier & attic ventilation |
Keeps attic cooler, reduces HVAC strain |
$1,500–$4,500 |
$1–$3/sq ft |
|
|
8/10 |
High-efficiency HVAC & smart thermostat |
Lowers cooling costs, extends system life |
$5,000–$12k |
varies |
|
|
7/10 |
Low-E or reflective window film |
Blocks infrared heat |
$800–$3,500 |
$5–$12/sq ft |
|
|
6/10 |
Shade landscaping (fire-safe trees, pergolas) |
Cuts indoor temps, lowers energy use |
$500–$4,000 |
varies |
|
Note: All prices are estimated on available unit prices as of report date. Quantities must be confirmed via a XHome Survey virtual inspection to calculate accurate project labor and material costs.
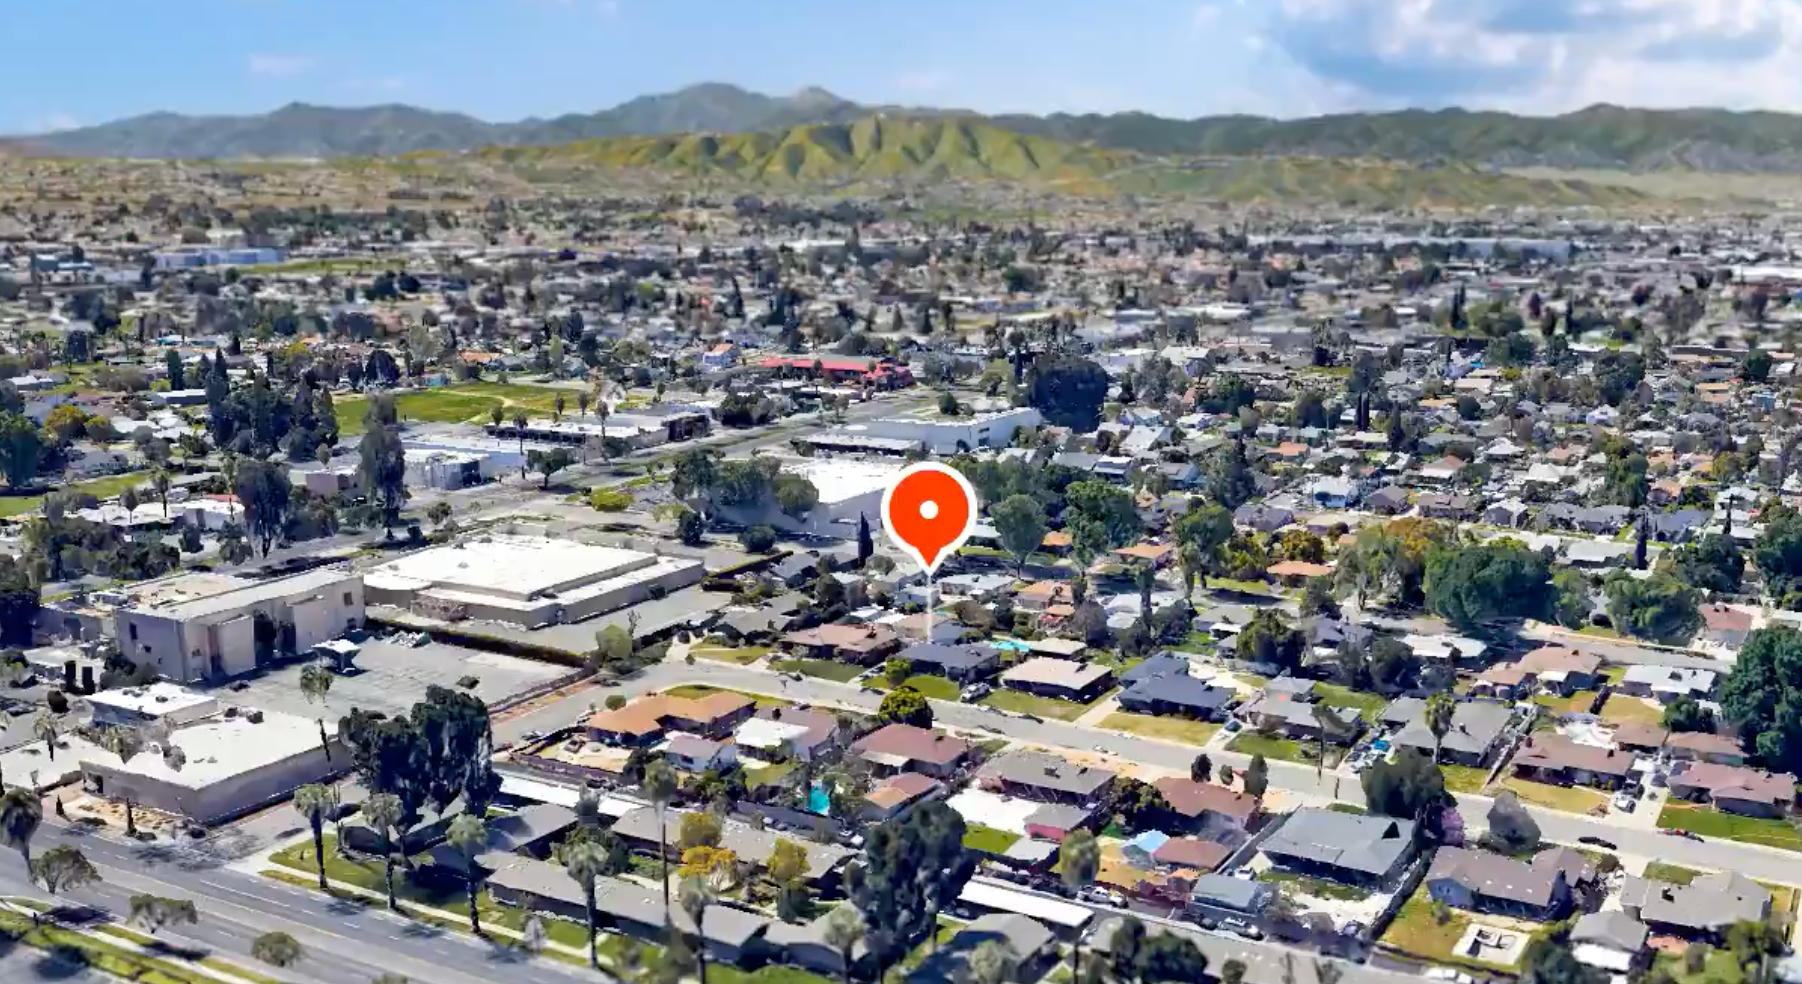
This home is in an urban–wildland interface area. Ember-driven ignition of roofs and vents is the top concern, compounded by drought-stressed vegetation and Santa Ana winds.
|
Risk Level |
Recommended Upgrade |
Why It Helps |
Est. Cost (Project) |
Est. Cost per Unit |
Product Link |
|
9/10 |
Ember-resistant vents/screens |
Blocks ember entry |
$600–$2,500 |
$100–$400/vent |
|
|
9/10 |
Class-A roof confirm/upgrade. |
Prevents roof ignition |
$12k–$35k |
$10–$25/sq ft |
|
|
8/10 |
Defensible space (clearance, trimming) |
Reduces ignition pathways |
$800–$4,000 |
varies |
|
|
7/10 |
Enclosed eaves & soffits |
Stops ember intrusion |
$2,000–$7,000 |
varies |
|
|
6/10 |
Dual-pane tempered windows |
Resists radiant heat & embers |
$10k–$25k |
$500–$1,200/window |
|
Note: All prices are estimated on available unit prices as of report date. Quantities must be confirmed via a XHome Survey virtual inspection to calculate accurate project labor and material costs.
Recurring drought cycles increase water restrictions, tree mortality, and wildfire intensity. Landscaping is the most affected system at this property..
|
Risk Level |
Recommended Upgrade |
Why It Helps |
Est. Cost (Project) |
Est. Cost per Unit |
Product Link |
|
8/10 |
Xeriscaping / turf conversion |
Saves water, reduces fire fuel |
$3,000–$10,000 |
$5–$15/sq ft |
|
|
8/10 |
Irrigation retrofits + rain capture |
Efficient use/storage |
$1,000–$6,000 |
~$0.50–$1.00/gal |
|
|
7/10 |
Drought-tolerant tree planting |
Maintains shade, lowers fire load |
$500–$3,000 |
varies |
|
|
6/10 |
Soil moisture sensors / smart irrigation |
Reduces overwatering |
$200–$800 |
$50–$100/zone |
|
|
6/10 |
Rain barrel rebate program participation |
Captures stormwater for use |
$200–$1,000 |
$0.50–$1.00/gal |
|
Note: All prices are estimated on available unit prices as of report date. Quantities must be confirmed via a XHome Survey virtual inspection to calculate accurate project labor and material costs.
Riverside is near the San Jacinto and Elsinore faults and within shaking distance of the San Andreas. Earthquakes are unpredictable but pose significant structural and financial risk.
|
Risk Level |
Recommended Upgrade |
Why It Helps |
Est. Cost (Project) |
Est. Cost per Unit |
Product Link |
|
9/10 |
Foundation bolting & cripple wall bracing |
Reduces collapse risk |
$3,000–$8,000 |
$20–$50/linear ft |
|
|
8/10 |
Seismic shut-off valve (gas line) |
Stops leaks after quake |
$500–$1,500 |
varies |
|
|
7/10 |
Water heater strapping & utility bracing |
Prevents gas leaks, water damage |
$200–$600 |
$50–$150/strap |
|
|
6/10 |
Chimney bracing or removal |
Prevents collapse and injury |
$2,000–$6,000 |
varies |
|
|
6/10 |
Heavy furniture/appliance anchoring |
Prevents injury and damage |
$200–$800 |
varies |
Note: All prices are estimated on available unit prices as of report date. Quantities must be confirmed via a XHome Survey virtual inspection to calculate accurate project labor and material costs.
Atmospheric rivers and El Niño events bring intense rainfall. While related to flood hazards, storms also cause roof leaks, gutter overflows, and mudflows post-fire.
|
Risk Level |
Recommended Upgrade |
Why It Helps |
Est. Cost (Project) |
Est. Cost per Unit |
Product Link |
|
8/10 |
Roof inspection & sealing |
Prevents water intrusion |
$500–$2,500 |
varies |
|
|
7/10 |
Gutter cleaning & guard installation |
Manages runoff efficiently |
$300–$1,200 |
$4–$8/linear ft |
|
|
7/10 |
Slope stabilization / erosion control |
Reduces mudflow risk |
$2,000–$10,000 |
varies |
|
|
6/10 |
Storm drain maintenance & backup pump |
Prevents ponding & water entry |
$500–$3,500 |
varies |
|
|
5/10 |
Weather-resistant exterior sealants |
Protects siding/windows from leaks |
$200–$1,000 |
varies |
|
Note: All prices are estimated on available unit prices as of report date. Quantities must be confirmed via a XHome Survey virtual inspection to calculate accurate project labor and material costs.
The property sits in the Santa Ana River Basin, where localized flooding and ponding can occur in heavy rains, especially during atmospheric river events..
|
Risk Level |
Recommended Upgrade |
Why It Helps |
Est. Cost (Project) |
Est. Cost per Unit |
Product Link |
|
8/10 |
Regrading, swales, downspouts |
Moves water away |
$2,000–$8,000 |
$500–$2,000/side |
|
|
8/10 |
Deployable flood barriers |
Prevents inflow |
$800–$3,000 |
$400–$1,200/opening |
|
|
7/10 |
Sump pump with backup power |
Removes standing water |
$1,500–$4,500 |
varies |
|
|
6/10 |
Foundation crack sealing & waterproofing |
Prevents seepage |
$1,000–$5,000 |
varies |
|
|
5.5/10 |
utilities (HVAC, electrical panels) |
Protects key systems |
$2,000–$7,000 |
varies |
|
Note: All prices are estimated on available unit prices as of report date. Quantities must be confirmed via a XHome Survey virtual inspection to calculate accurate project labor and material costs.
Insurance premium costs are escalating due to more frequent and costly disasters. Insurance companies are leaving markets. Property owners either can’t get covered, are facing huge premium increases, and subsequent loss of insurance which leads to home loss and foreclosures.
Mitigating specific risks through home upgrades may make you eligible for premium discounts through your insurance carrier.
|
Hazard |
Upgrade Option |
Program |
Requirement |
Discount % |
Annual Savings |
|
Wildfire |
Defensible space + vents + Class-A roof |
Safer from Wildfires |
Mitigation verified |
5–15% |
$200–$600 |
|
Wildfire |
Defensible space + vents + Class-A roof |
Safer from Wildfires |
Mitigation verified |
5–15% |
$200–$600 |
|
Wildfire |
Roof + ember protections |
CA FAIR Plan |
Hardening checklist |
~10% |
varies |
|
Flood |
Drainage/barriers |
Carrier-specific |
Documentation |
5–10% |
$50–$200 |
|
Seismic |
Retrofit (bolting, bracing) |
Some carriers/CEA |
Retrofit certification |
varies |
varies |
Note: Annual savings are based on average insurance discounts, energy/water reductions available in your area, avoidable losses are estimated on your community (actual results may vary).
Note: Submitting documentation and proof is critical for both insurance and public funding. Attach forms when submitting evidence of qualified upgrades.
Available resources may assist you with the cost of upgrades listed and recommended in this report. Some sources are tied to hazards, while others are general-purpose.
|
Hazard |
Program |
Type |
Est. Value |
Notes |
|
Wildfire |
Safer from Wildfires |
Discount |
Premium reduction |
Carrier filings |
|
Wildfire |
Firewise USA |
Recognition |
Varies |
Some carriers recognize |
|
Wildfire |
FEMA/local programs |
Guidance/funding |
varies |
Depends on zone |
|
Flood/Drainage |
Turf replacement rebate |
Rebate |
$500–$2,000 |
Local water agency |
|
Seismic |
CEA Brace+Bolt |
Grant |
Up to $3,000 |
Eligible properties only |
Note: Before major work, confirm eligibility for rebates or grants—some programs are first-come, first-served and may have funding caps and/or application deadlines.
Upfront investments in completed resilience upgrades pay off through reduced damage risk, lower premiums, utility savings, and rebate reimbursements.
|
Savings Category |
Sub-Category |
1-Year |
3-Year |
5-Year |
|
Insurance Discounts |
Wildfire hardening (roof, vents, defensible space) |
$200–$600 |
$600–$1,800 |
$1,000–$3,000 |
|
Seismic retrofit (foundation bolting, bracing, shut-off valve) |
$50–$300 |
$150–$900 |
$300–$1,500 |
|
|
Floodproofing (drainage, barriers, CRS community rating) |
$50–$200 |
$150–$600 |
$300–$1,000 |
|
|
Subtotal – Insurance Discounts |
|
$300–$1,100 |
$900–$3,300 |
$1,600–$5,500 |
|
Direct Costs Avoided |
Wildfire damage reduction |
$5,000 |
$15,000 |
$30,000 |
|
Seismic structural reinforcement |
$2,500 |
$7,500 |
$15,000 |
|
|
Flood/storm intrusion prevention |
$2,000 |
$6,000 |
$12,000 |
|
|
Heat-related roof/HVAC wear avoided |
$500 |
$1,500 |
$3,000 |
|
|
Subtotal – Direct Costs |
|
$10,000 |
$30,000 |
$60,000 |
|
Indirect Costs Avoided |
Smoke damage, evacuation costs, displacement |
$500 |
$1,500 |
$2,500 |
|
Heat-related health risks (cooling, medical, productivity) |
$250 |
$750 |
$1,500 |
|
|
Subtotal – Indirect Costs |
|
$750 |
$2,250 |
$4,000 |
|
Utility Savings |
Cool roof, attic venting, HVAC upgrades |
$150 |
$450 |
$800 |
|
Smart irrigation & xeriscaping |
$100 |
$300 |
$600 |
|
|
Subtotal – Utility Savings |
|
$250 |
$750 |
$1,400 |
|
Rebates & Grants |
Turf replacement, rainwater capture rebates |
$500 |
$1,500 |
$2,500 |
|
CEA seismic retrofit grant (if eligible) |
$1,000 |
$3,000 |
$3,000 |
|
|
Subtotal – Rebates & Grants |
|
$1,500 |
$4,500 |
$5,500 |
|
Total Potential Annual Savings |
|
$12,800–$13,600 |
$38,400–$41,800 |
$72,500–$76,400 |
Important environmental, insurance, and building code regulations that apply to your region are highlighted in the chart below. State and local requirements that may affect your ability to complete upgrades, qualify for funding, or reduce insurance costs are included. Some programs are mandatory for insurance eligibility, while others are voluntary but provide financial or permitting advantages.
|
Hazard Type |
Regulation / Policy Name |
Program Type |
Enforcement |
|
Wildfire |
Safer from Wildfires (CA DOI) |
Insurance credit |
Statewide |
|
Wildfire |
Fire Hazard Severity Zones (CAL FIRE) |
Hazard mapping |
Local + State |
|
Flood |
FEMA NFIP / County Floodplain |
Mapping & Insurance |
FEMA + County |
|
Heat/Drought |
Model Water Efficient Landscape Ordinance |
Water efficiency |
Local agency |
|
Seismic |
CA Seismic Retrofit Programs (CEA Brace+Bolt) |
Grant/mitigation |
Voluntary but incentivized |
Below are local and federal agencies, organizations, and programs that support disaster mitigation and resilience upgrades in your region.
|
Resource/Agency |
Website / Contact Info |
|
Riverside County Fire |
|
|
City of Riverside Fire |
|
|
FEMA Flood Map Service Center |
|
|
Ready Riverside County |
|
|
NFPA Firewise USA |
|
|
CEA Earthquake Authority |
|
Resource/Agency |
Description |
Website / Contact Info |
|
Watch Duty (Fire alerts) |
|
Watch Duty (Fire alerts) |
|
Ready Riverside Alerts |
|
Ready Riverside Alerts |
|
SoCal Turf/Water Rebates |
SoCal Turf/Water Rebates |
By tackling America’s housing resilience crisis, we create value for homeowners, contractors, insurers, and investors. This unique heart-and-profit opportunity uses AI to safeguard homes, save lives, and prevent possible financial collapse—building a safer, more resilient future for families and children while delivering a private-sector solution to a growing public crisis.
Like the weather, risk is constantly changing. A Future Proof subscription levels the playing field between homeowners and insurance carriers by providing annual, property-specific risk reports. Your subscription includes one property address report and renews annually.
Powered by IBM’s supercomputers—processing global data from academic institutions and agencies taking over two weeks—our forward-looking models deliver unmatched risk analysis. Just because your property is in the clear today means it will be tomorrow.. your insurance carrier knows, good idea you should too.
Your subscription keeps you ahead of shifting threats with annual updates and new features like our coming extreme weather alert system, enhancing protection and prevention for greater personal safety.
As disaster footprints expand and government support declines, staying informed is critical. Future Proof helps you protect your home, your family, and your future—because chance favors the prepared mind.
Own vacation properties, duplexes, or apartment buildings? Future Proof offers discounted multi-property address packages—each including added benefits like tailored construction enhancements and strategies to reduce costs. Packages renew on every property in your catalog annually
Future Proof’s methodology is simple: combine top insurance risk models with imaging from Apple, Google, EagleView, and our XHome Survey™ app to digitally deconstruct each property with AI.
We identify vulnerabilities, apply code-compliant engineering, and use climate-resilient materials to virtually remodel homes for durability. Leveraging 500B+ data points from IBM, NOAA, FEMA, and The Weather Co., we assess risks against America’s aging housing stock—averaging 60 years old.
With computer vision, we detect flaws, apply best practices, and deliver affordable, effective plans—then connect you with suppliers, contractors, and financing. We build a detailed property dossier and generate innovative AI-driven solutions no other service can match—helping protect families and addressing the growing insurance crisis.
In insurance and mortgage underwriting, remediation means upgrades that reduce a property’s vulnerability to hazards like fire, flood, or extreme weather. These improvements lower risk scores, qualify homeowners for premium discounts, grants, tax credits, and better mortgage terms. For lenders, remediation protects collateral value and reduces claim losses.
Insurance operates like a casino—betting your home won’t be hit. When too many properties in an area share high risk, insurers raise premiums, restrict coverage, or exit altogether. Future Proof™ changes this dynamic by combining precise risk identification on your property with engineered remediation. We help harden structures, reduce claims, and keep insurance viable for both owners and carriers.
Insurers use risk tables that factor in claims history, community data, and construction details such as materials, stories, elevation, and exposure to wildfire, flood, or storms. Future Proof analysis employs this data.
State and local programs often fund resilience upgrades—like fortified roofs, impact-resistant windows, drainage improvements, or wildfire defensible space—through grants, tax credits, or low-interest loans. At the same time, modern building codes increasingly require higher standards, even for retrofits. Future Proof’s XHome Survey™ reports align with 2024 International Building and Fire Codes and connect you with local departments to simplify compliance.
|
"At Future Proof, we’re tackling the extreme |
Our roots go back to 2019, when The Paulele Hale Association a Hawai’i non-profit built the first ‘Future Proof’ home—designed to withstand wildfire heat up to 1200°F, 150 mph hurricane winds, earthquakes, and drought with autonomous water generation. Their insurance provider acknowledged its engineered resilience with a 15% discount, substantiating mitigation saves money.
While the causes of climate change are debated, its impacts are undeniable. A warming atmosphere and shifting water cycles are driving stronger storms, rising seas, prolonged droughts, and record wildfires. Disasters are reaching places once considered safe, disrupting lives, communities, and economies. Future Proof helps families confront these risks with practical, data-driven solutions.
We’ve since developed an AI-powered platform that uses advanced imaging to conduct precise property surveys, integrate insurance risk data, and generate cost-effective remediation plans. We connect homeowners to local contractors, material suppliers, and green financing so they can strengthen their homes and keep insurance affordable.
The Future Proof Extreme Weather Community Risk and Mitigation Report, is generated by the Visionary AI Engine™ using the Magic Window® app.
With IBM Climate Intelligence models and Visionary AI’s deep learning knowledge base of construction we show how extreme weather may impact your property over the next 25+ years.
Magic Window is designed to inform property owners, assess community-level risk and generate disaster risk estimates and their potential impact, make remodeling recommendations, estimate savings, and provide resources to help reduce your property’s vulnerabilities.
The XHome Survey™ app (coming soon) creates a digital 3D twin of your property to inspect, then applies advanced engineering to deliver detailed remediation plans, budgets, financing options, with links to suppliers and contractors.
Future Proof’s holistic approach demonstrates how targeted remodeling improves safety, increases value, lowers insurance costs, and connects you with local resources.
Future Proof Intelligence PBC is a for profit, public benefit corporation with a legally mandated mission we actively pursue and report on to our shareholders, customers and the State of Delaware.
Have questions? For more about Future Proof, our AI Platform, your property and our mission to help protect it ask our FutureView agent “Nina”- scan below or visit futureproof.org
|
Proprietary/Confidential |
|
|
Sept 23, 2025 |